 Niwa
NiwaUSDA hardiness zones explained
Your hardiness zone answers exactly one question: how cold does it get here in an average winter. It is the most quoted number in gardening and the most misread.
The USDA Plant Hardiness Zone Map divides the United States into 13 zones based on one number: the average annual extreme minimum winter temperature. That is the whole definition. Everything people commonly do with a zone beyond that is either an approximation or a mistake.
It is still worth understanding properly, because when it is the right tool it is the only tool.
What a zone actually measures
A hardiness zone is the average annual extreme minimum temperature for a location, calculated from 30 years of records. Read that phrase carefully, because each word is doing work:
- Average means it is a typical year, not a guarantee. A once-in-twenty-years cold snap will go below your zone.
- Annual extreme minimum means the single coldest night of each year, not the average winter temperature.
- Temperature means air temperature, with nothing said about rainfall, humidity, soil, wind or summer heat.
So the zone answers one question: will a perennial that needs to survive winter outdoors here actually survive it. For a plant that lives one season and dies, which is most vegetables, the zone is close to irrelevant.
The full zone table
Each numbered zone spans 10 degrees Fahrenheit. Lower numbers are colder.
| Zone | Average annual minimum (F) | Celsius | Roughly where |
|---|---|---|---|
| Zone 1 | -60 to -50 | -51 to -46 | Interior Alaska |
| Zone 2 | -50 to -40 | -46 to -40 | Northern Alaska, far northern plains |
| Zone 3 | -40 to -30 | -40 to -34 | Northern Minnesota, North Dakota |
| Zone 4 | -30 to -20 | -34 to -29 | Upper Midwest, northern New England |
| Zone 5 | -20 to -10 | -29 to -23 | Chicago, Denver, much of New England |
| Zone 6 | -10 to 0 | -23 to -18 | Mid-Atlantic, Ohio Valley, Kansas |
| Zone 7 | 0 to 10 | -18 to -12 | Virginia, Oklahoma, Pacific Northwest |
| Zone 8 | 10 to 20 | -12 to -7 | Georgia, Texas, coastal Oregon |
| Zone 9 | 20 to 30 | -7 to -1 | Florida panhandle, central California |
| Zone 10 | 30 to 40 | -1 to 4 | Southern Florida, southern California |
| Zone 11 | 40 to 50 | 4 to 10 | Florida Keys, Hawaii |
| Zone 12 | 50 to 60 | 10 to 16 | Hawaii, Puerto Rico |
| Zone 13 | 60 to 70 | 16 to 21 | Puerto Rico, tropical territories |
What the a and b mean
Every zone is split into two half zones of 5 degrees each. The a half is the colder half and the b half is the warmer half.
| Half zone | Average annual minimum (F) |
|---|---|
| 6a | -10 to -5 |
| 6b | -5 to 0 |
| 7a | 0 to 5 |
| 7b | 5 to 10 |
The half zone matters when a plant is marginal for you. A fig rated to zone 7 will probably survive in 7b and probably will not in 7a without protection. For annual vegetables the half zone almost never changes a decision.
What changed in the 2023 map
The current map was released in November 2023, replacing the 2012 edition. It was produced by the USDA Agricultural Research Service together with Oregon State University's PRISM Climate Group.
| 2012 map | 2023 map | |
|---|---|---|
| Data period | 1976 to 2005 | 1991 to 2020 |
| Weather stations | 7,983 | 13,412 |
Across the contiguous United States the new map is about 2.5 degrees Fahrenheit warmer than the old one. Roughly half the country moved into the next warmer half zone, and roughly half stayed where it was.
Two things drove that shift, and it is worth separating them. Part is a genuinely warmer 30 year period. Part is simply better data: 5,429 additional weather stations and improved interpolation resolve local detail the older map could not see. The USDA has been explicit that the map is not designed as evidence of climate change, because a single coldest night per year is a volatile statistic.
Practically: if you learned your zone before 2024, look it up again. You may be half a zone warmer on paper without your garden having changed at all.
How to find your zone
Enter your postal code on the USDA Plant Hardiness Zone Map. You will get a zone and a half zone, such as 6b.
Two cautions. First, neighbouring postal codes often fall in different zones, which is normal and reflects elevation, water and urban heat. Second, a postal code can be large and contain more than one zone, so a lookup returns the dominant zone rather than your garden's.
Four things your zone cannot tell you
This is the part that costs people harvests.
1. When to plant anything
Your zone describes January. It says nothing about when spring arrives or how long the growing season lasts. Two gardens in the same zone can have last frost dates three weeks apart, and three weeks is the difference between a tomato that ripens and one that does not. Planting dates come from frost dates, which are separate data, covered in when to plant vegetables in your zone.
2. How hot your summer gets
Hardiness zones measure cold only. Coastal Oregon and northern Georgia share zone 8, and their summers have almost nothing in common. Lettuce that thrives all summer in one bolts in June in the other. Zone 8 in the Pacific Northwest is a cool maritime climate; zone 8 in the Deep South is humid and hot.
3. Rainfall, humidity and soil
Phoenix and coastal Florida overlap in zone. One is desert, the other subtropical and wet. Everything about irrigation, mulching, fungal disease pressure and soil management differs, and the zone reports none of it.
4. What is happening in your actual garden
A map cell is roughly half a mile across. Your garden is not, and a walled south-facing bed can run a full zone warmer than the frost pocket at the bottom of the same plot.
Heat zones and other systems
Because hardiness zones only handle cold, other systems fill the gaps. You will meet these on plant labels.
| System | What it measures | Useful for |
|---|---|---|
| USDA hardiness zone | Average annual coldest night | Will a perennial survive winter |
| AHS heat zone | Average days per year above 86F / 30C | Will a plant survive summer |
| Sunset climate zone | Cold, heat, rainfall, humidity, season length | Far more precise, western US mainly |
| RHS hardiness rating | UK equivalent, H1a to H7 | British plant labels |
A plant labelled "4 to 9" is giving a hardiness range: hardy down to zone 4, and unhappy above zone 9 because it needs winter chill it will not get.
Your garden is not the map
Microclimates routinely shift the effective zone by half a zone in either direction. Warmer than the map: south-facing walls, which absorb heat and release it overnight; paving and gravel; the lee side of a building; anywhere in a town, because urban heat is real and measurable.
Colder than the map: low-lying ground where cold air pools, which is why frost pockets exist; open exposed sites with no windbreak; the north side of anything; the top of a hill.
The practical test is observation. If frost lingers in one corner of your garden every morning after it has cleared elsewhere, that corner is colder than your zone claims, whatever the map says.
Using your zone properly
Used correctly, your zone answers perennial questions: will this fruit tree, asparagus crown, rhubarb, rosemary or lavender survive the winter here. Buy anything rated to your zone number or lower and it should come through. Buy something rated warmer and you are gambling or committing to winter protection.
For annual vegetables, the zone is a supporting figure and frost dates do the real work. The reason both matter is that they answer different halves of the same question, and you need both to build a planting schedule.
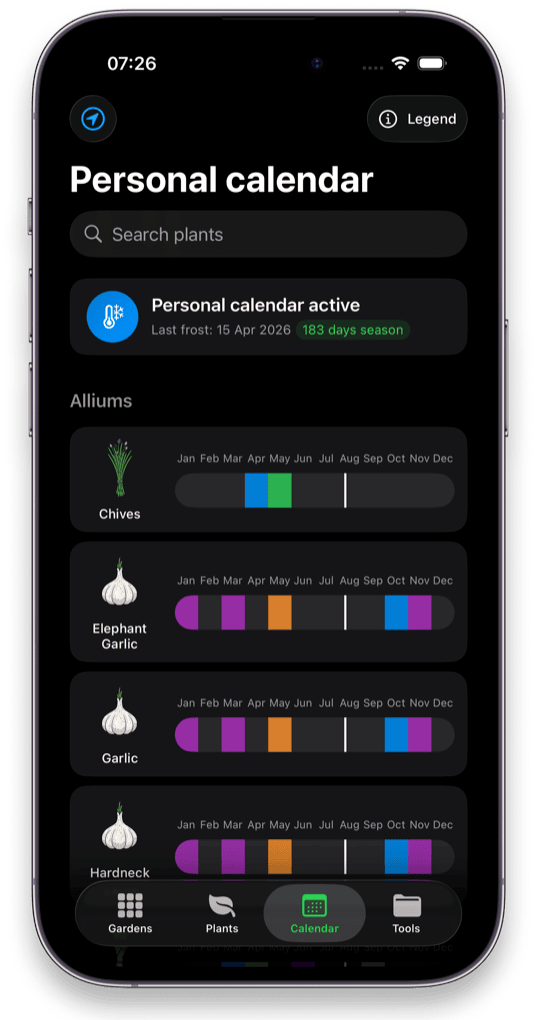
Next: when to plant vegetables in your zone turns these two numbers into actual sowing dates, and when to start seeds indoors counts backwards from your last frost.